
Should I Still Use Grafana?
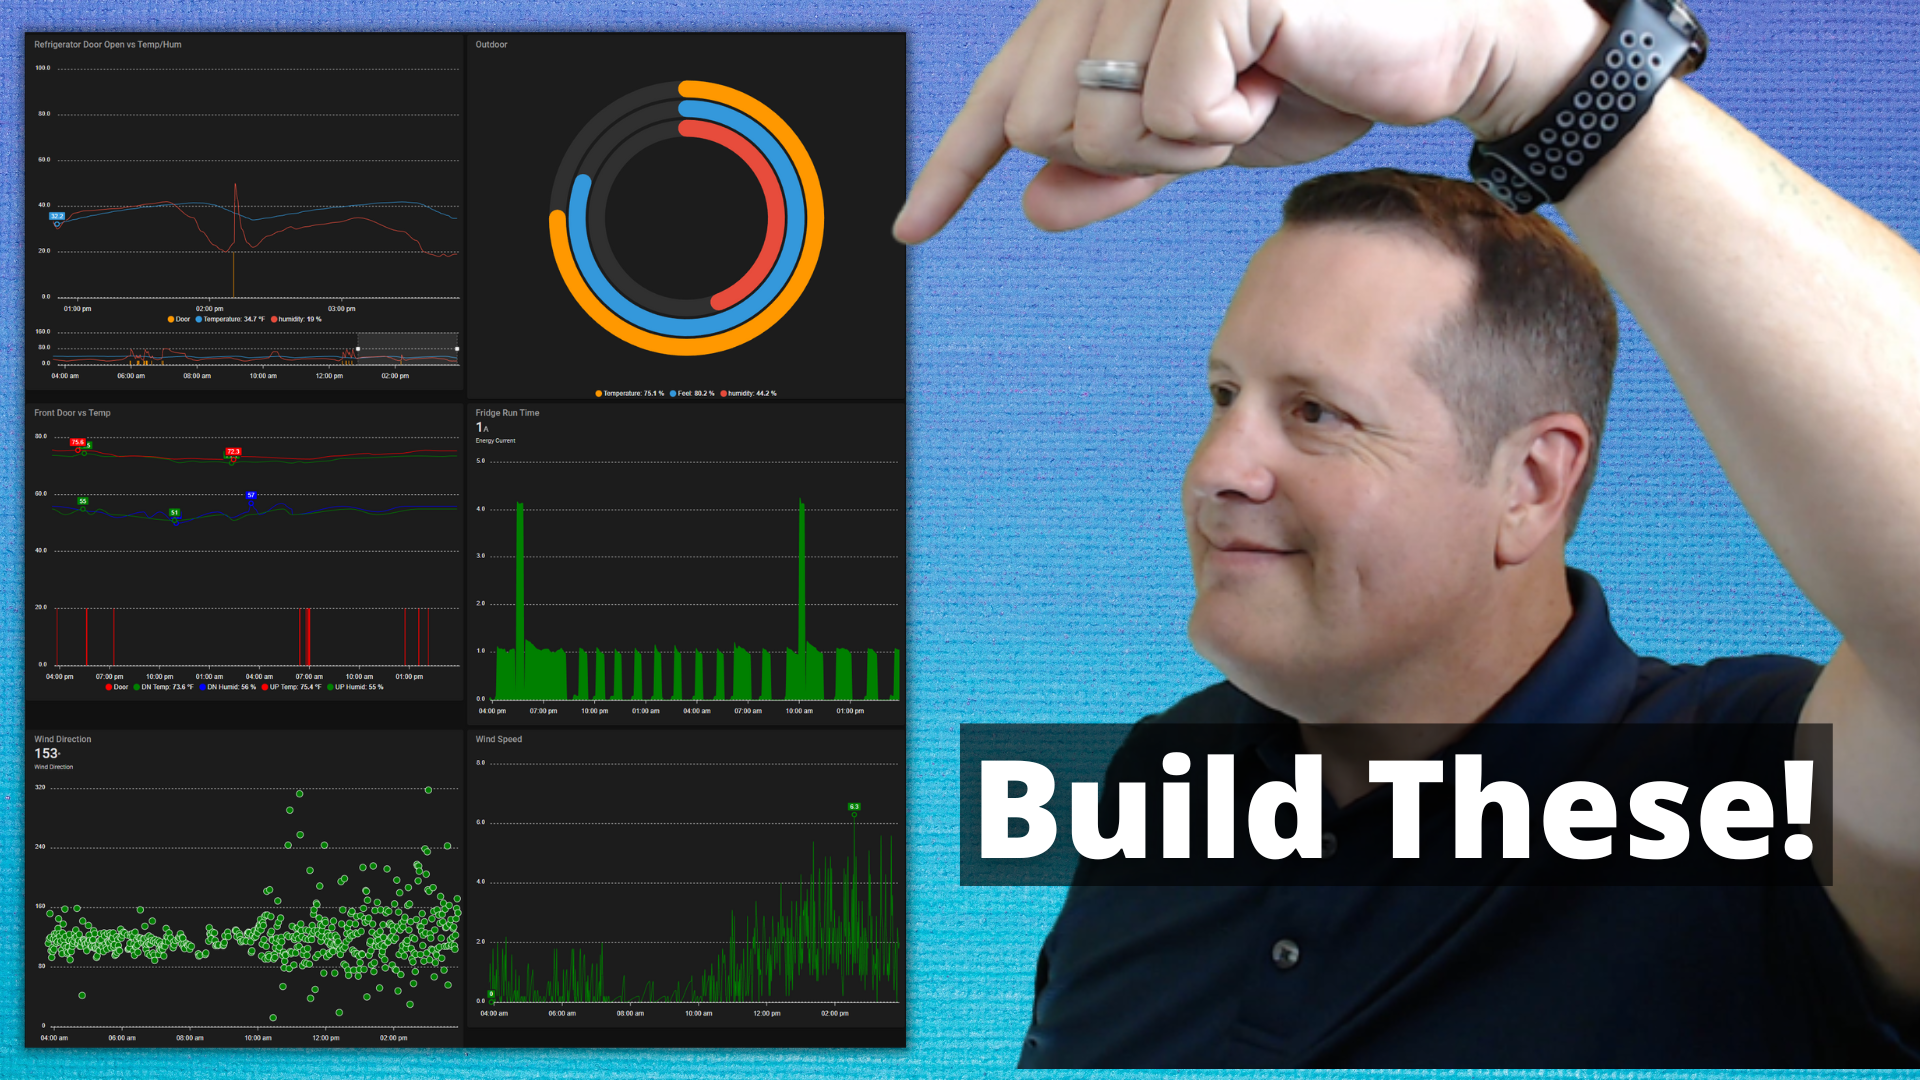
Well... that was going to be the title anyway. As I began writing and filming this post/video I realized that I had a way to do data correlation (cause and effect) using Apex Charts. I use the word correlation loosely and not in any super scientific way. It's my way of saying that I want to see if something changes when another thing happens. Nice, huh?
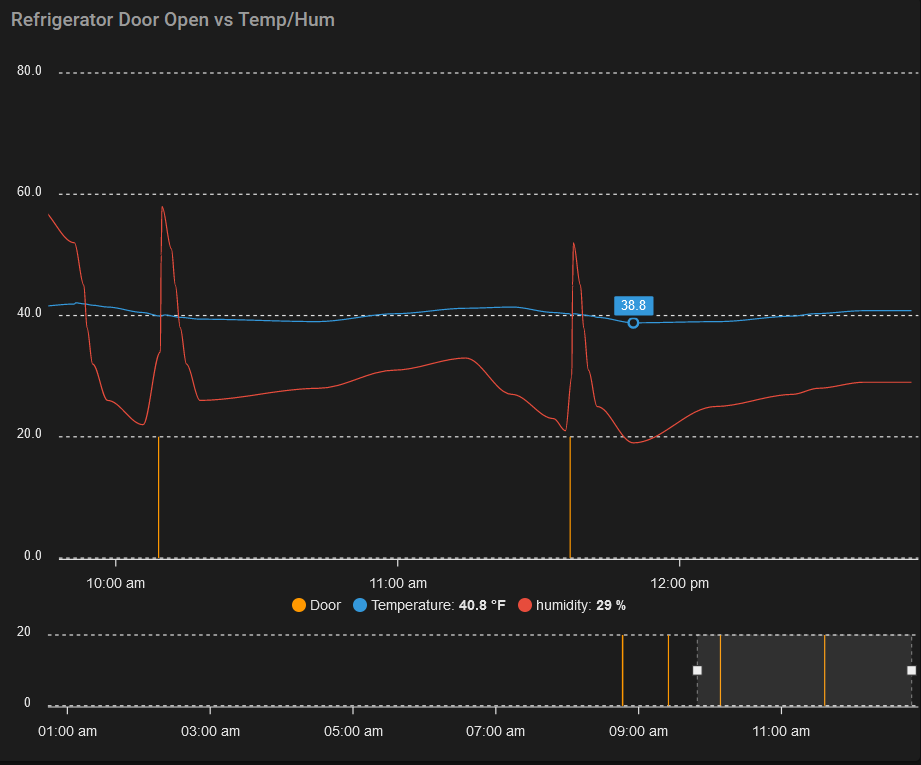
One such "correlation" is to see what happens to the temperature and humidity inside the refrigerator when the refrigerator door is opened. I might have a little bit of OCD when doors are left open and all the cool leaves (just ask my family about that). As it turns out, I can relax because it doesn't appear the temperature really changes that much at all. There is a spike in humidity, but that doesn't bother me as much.
I have wondered the same thing when it comes to house temperature and humidity when an external door is open. Guess what! I can do the same type of graph with that data.
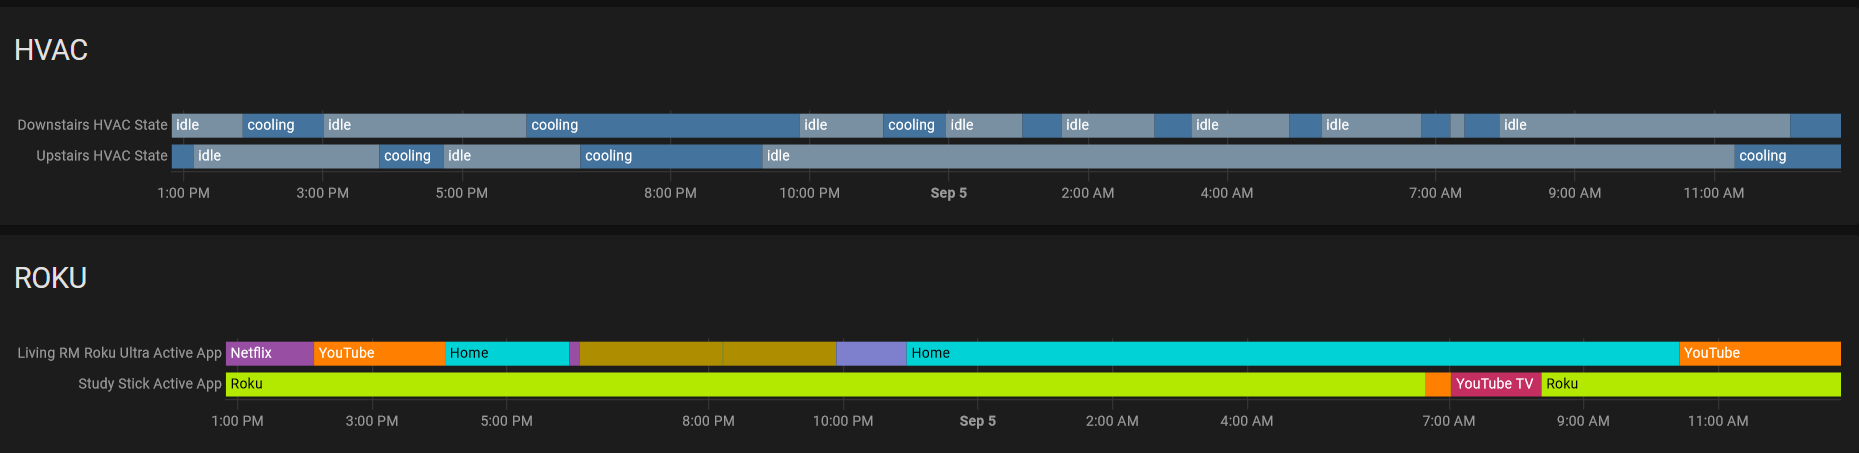
I have quite a few graphs in Grafana and over the years, Home Assistant has gotten much better with its built-in graphs. One type of graph that took me a bit of time to build in Grafana was only a couple of clicks to add in Home Assistant. Using History Graphs, I can build out this type of thing very quickly.
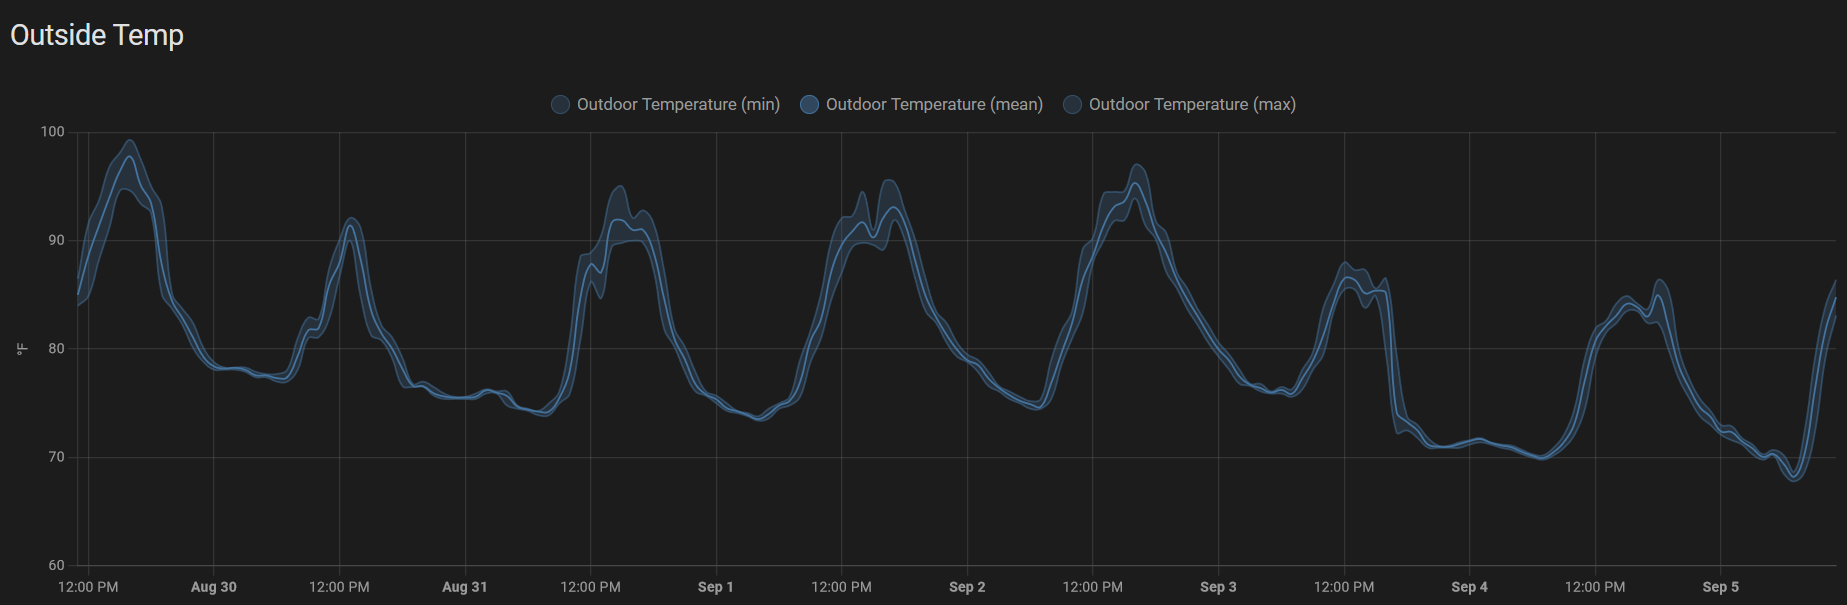
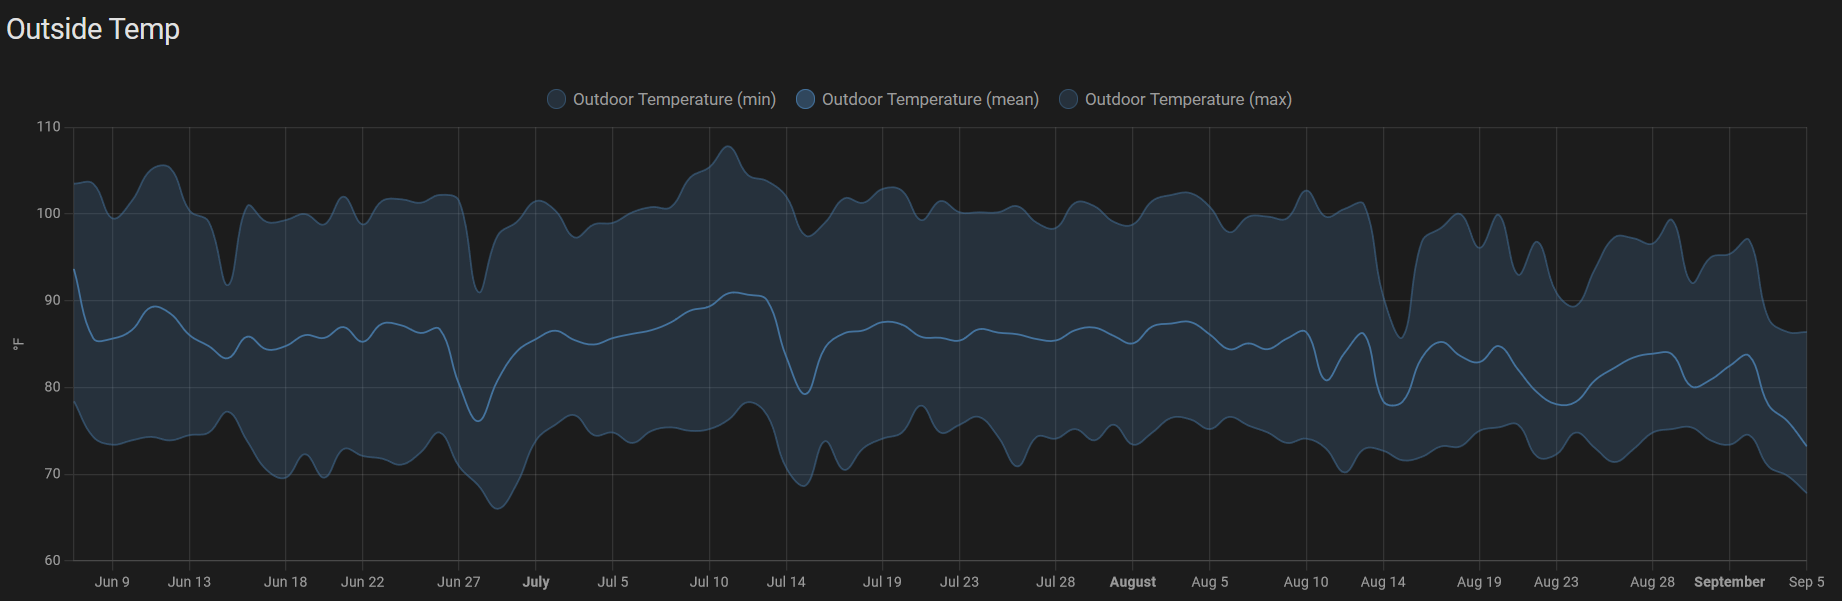
Another example of a built-in Home Assistant graph is a statistics graph. With this type of graph, you can plot mean, min, and max values over hours, days, weeks, or years. This is especially useful when viewing trends.
There are many other ways to use Apex Charts as well as Home Assistant native charts. Do I still need Grafana? Yes, for very specialized views. However, for daily viewing of specific items, especially those noted above, the Home Assistant graphs along with Apex Charts are more than adequate.
Take a look at my video for more details and a run through on how I built the graphs.
For those that are looking for the code, here it is.
         - type: custom:apexcharts-card
            header:
              show: true
              title: Refrigerator Door Open vs Temp/Hum
              show_states: false
              colorize_states: true
            graph_span: 12h
            all_series_config:
              stroke_width: 1
              opacity: 1
            experimental:
              brush: true
            series:
              - entity: binary_sensor.fridge_door_sensor_js
                type: column
                transform: 'return x === ''on'' ? 20 : 0;'
                name: Door
                show:
                  legend_value: false
                  in_brush: true
              - entity: sensor.fridge_aqara_sensor_temperature
                type: line
                name: Temperature
                show:
                  extremas: true
              - entity: sensor.fridge_aqara_sensor_humidity
                type: line
                name: humidity
                show:
                  extremas: true
          - type: custom:apexcharts-card
            chart_type: radialBar
            header:
              show: true
              title: Outdoor
              show_states: false
            all_series_config:
              max: 120
            series:
              - entity: sensor.outdoor_temperature
                name: Temperature
              - entity: sensor.new_buck_creek_feels_like
                type: line
                name: Feel
              - entity: sensor.humidity
                type: line
                name: humidity
                    - type: custom:apexcharts-card
            color_list:
              - red
              - green
              - blue
            header:
              show: true
              title: Front Door vs Temp
              show_states: false
              colorize_states: true
            graph_span: 24h
            all_series_config:
              stroke_width: 1
              opacity: 1
            series:
              - entity: binary_sensor.front_garage_door_entry
                type: column
                transform: 'return x === ''on'' ? 20 : 0;'
                name: Door
                show:
                  legend_value: false
              - entity: sensor.downstairs_temperature
                type: line
                name: DN Temp
                show:
                  extremas: true
              - entity: sensor.downstairs_humidity
                type: line
                name: DN Humid
                show:
                  extremas: true
              - entity: sensor.upstairs_temperature
                type: line
                name: UP Temp
                show:
                  extremas: true
              - entity: sensor.upstairs_humidity
                type: line
                name: UP Humid
                show:
                  extremas: true
          - type: custom:apexcharts-card
            color_list:
              - green
              - blue
            header:
              show: true
              title: Fridge Run Time
              show_states: true
            graph_span: 24h
            all_series_config:
              stroke_width: 1
              opacity: 1
            series:
              - entity: sensor.fridgeplug_energy_current
                name: Energy Current
                type: area
                    - type: custom:apexcharts-card
            color_list:
              - green
              - blue
            chart_type: scatter
            header:
              show: true
              title: Wind Direction
              show_states: true
            graph_span: 12h
            all_series_config:
              stroke_width: 1
              opacity: 1
            series:
              - entity: sensor.wind_direction_2
          - type: custom:apexcharts-card
            color_list:
              - green
              - blue
            header:
              show: true
              title: Wind Speed
            graph_span: 12h
            all_series_config:
              stroke_width: 1
              opacity: 1
            series:
              - entity: sensor.new_buck_creek_wind_speed
      - type: history-graph
        entities:
          - entity: sensor.downstairs_hvac_state
          - entity: sensor.upstairs_hvac_state
        title: HVAC
        hours_to_show: 24
        refresh_interval: 60
      - type: history-graph
        entities:
          - entity: sensor.living_rm_roku_ultra_active_app
          - entity: sensor.study_stick_active_app
        title: ROKU
        hours_to_show: 24
        refresh_interval: 60
      - chart_type: line
        period: day
        days_to_show: 90
        type: statistics-graph
        entities:
          - sensor.outdoor_temperature
        stat_types:
          - mean
          - min
          - sum
          - max
        title: Outside Temp