
Automatic Home Assistant Dashboards
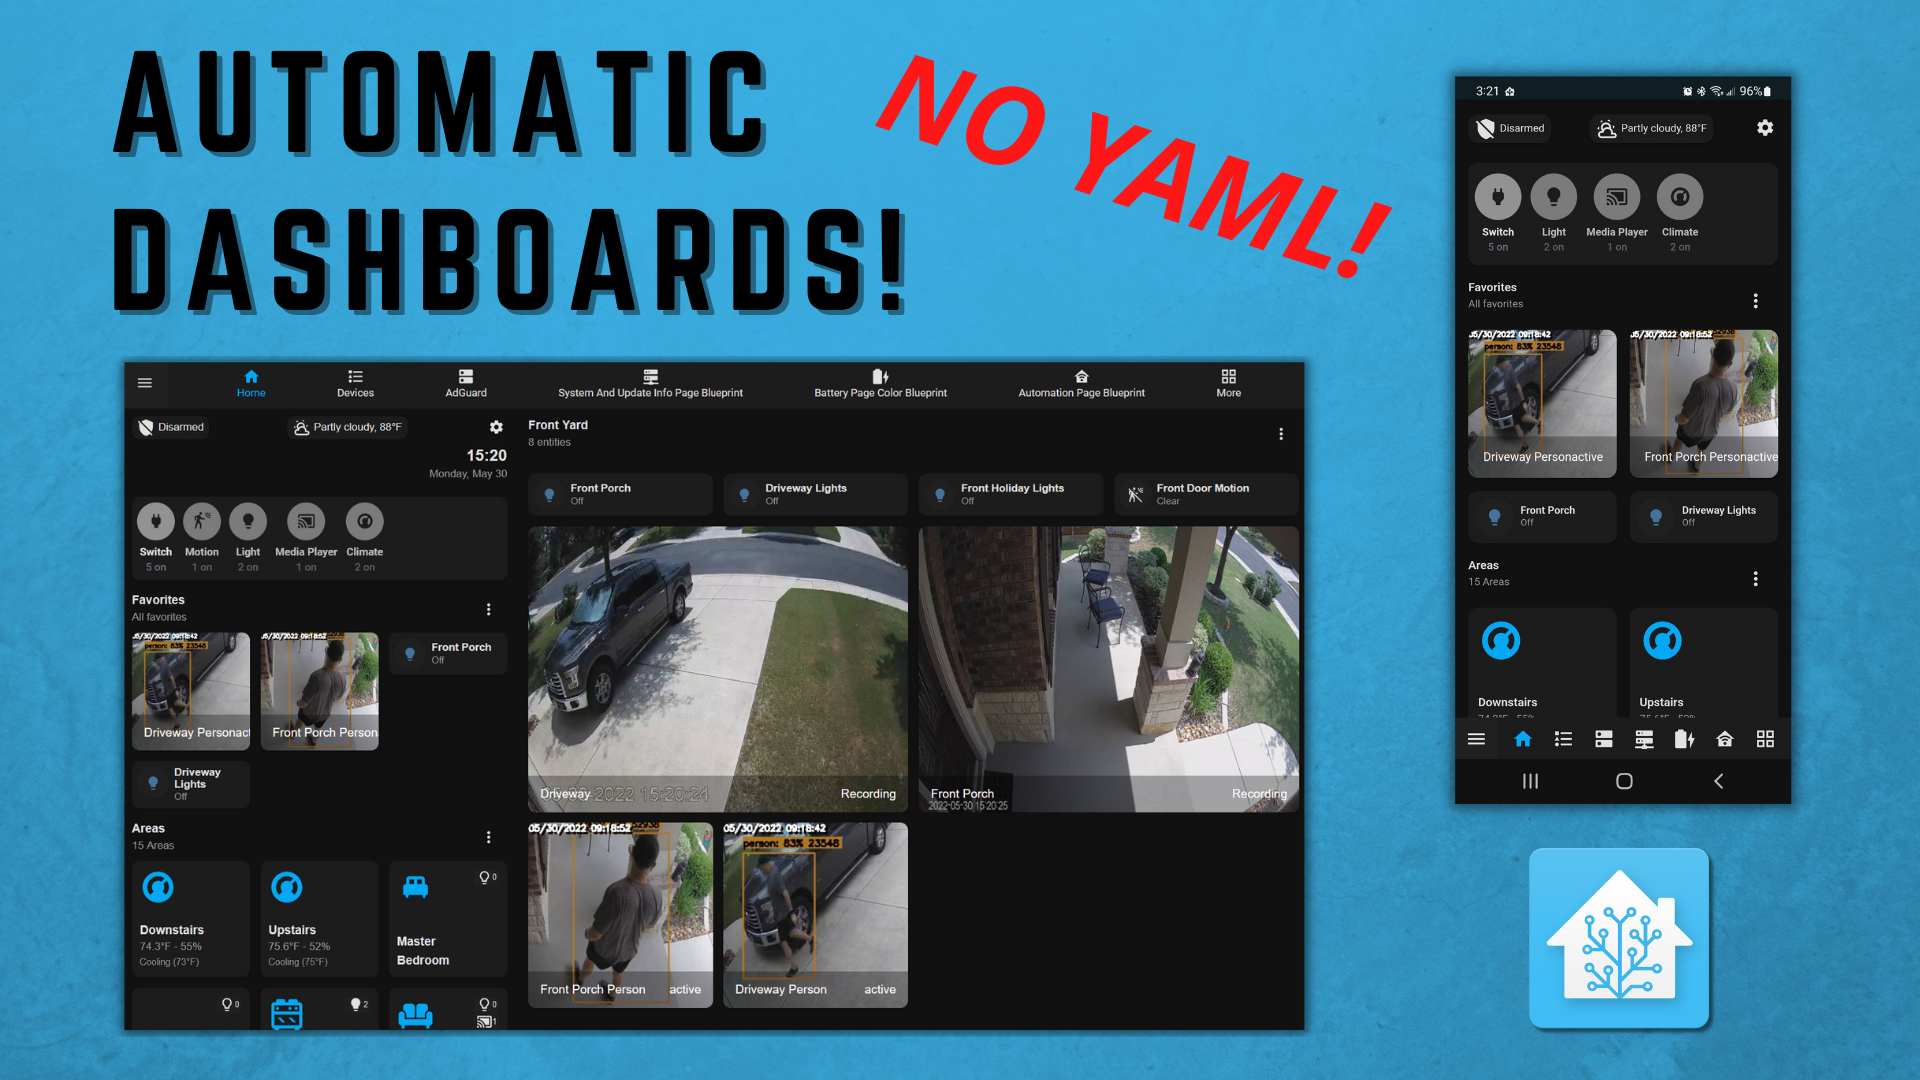
One of the great things about Home Assistant is the many different ways to create dashboards and interfaces that are useful for your specific use cases. In addition to creating these dashboards manually, Dwain Scheeren has created an integration called Dwains Lovelace Dashboard. This is touted as a "fully auto generating Home Assistant UI dashboard for desktop, tablet and mobile". This requires NO YAML to create these dashboards!
I took this auto-generating dashboard for a spin in this video.
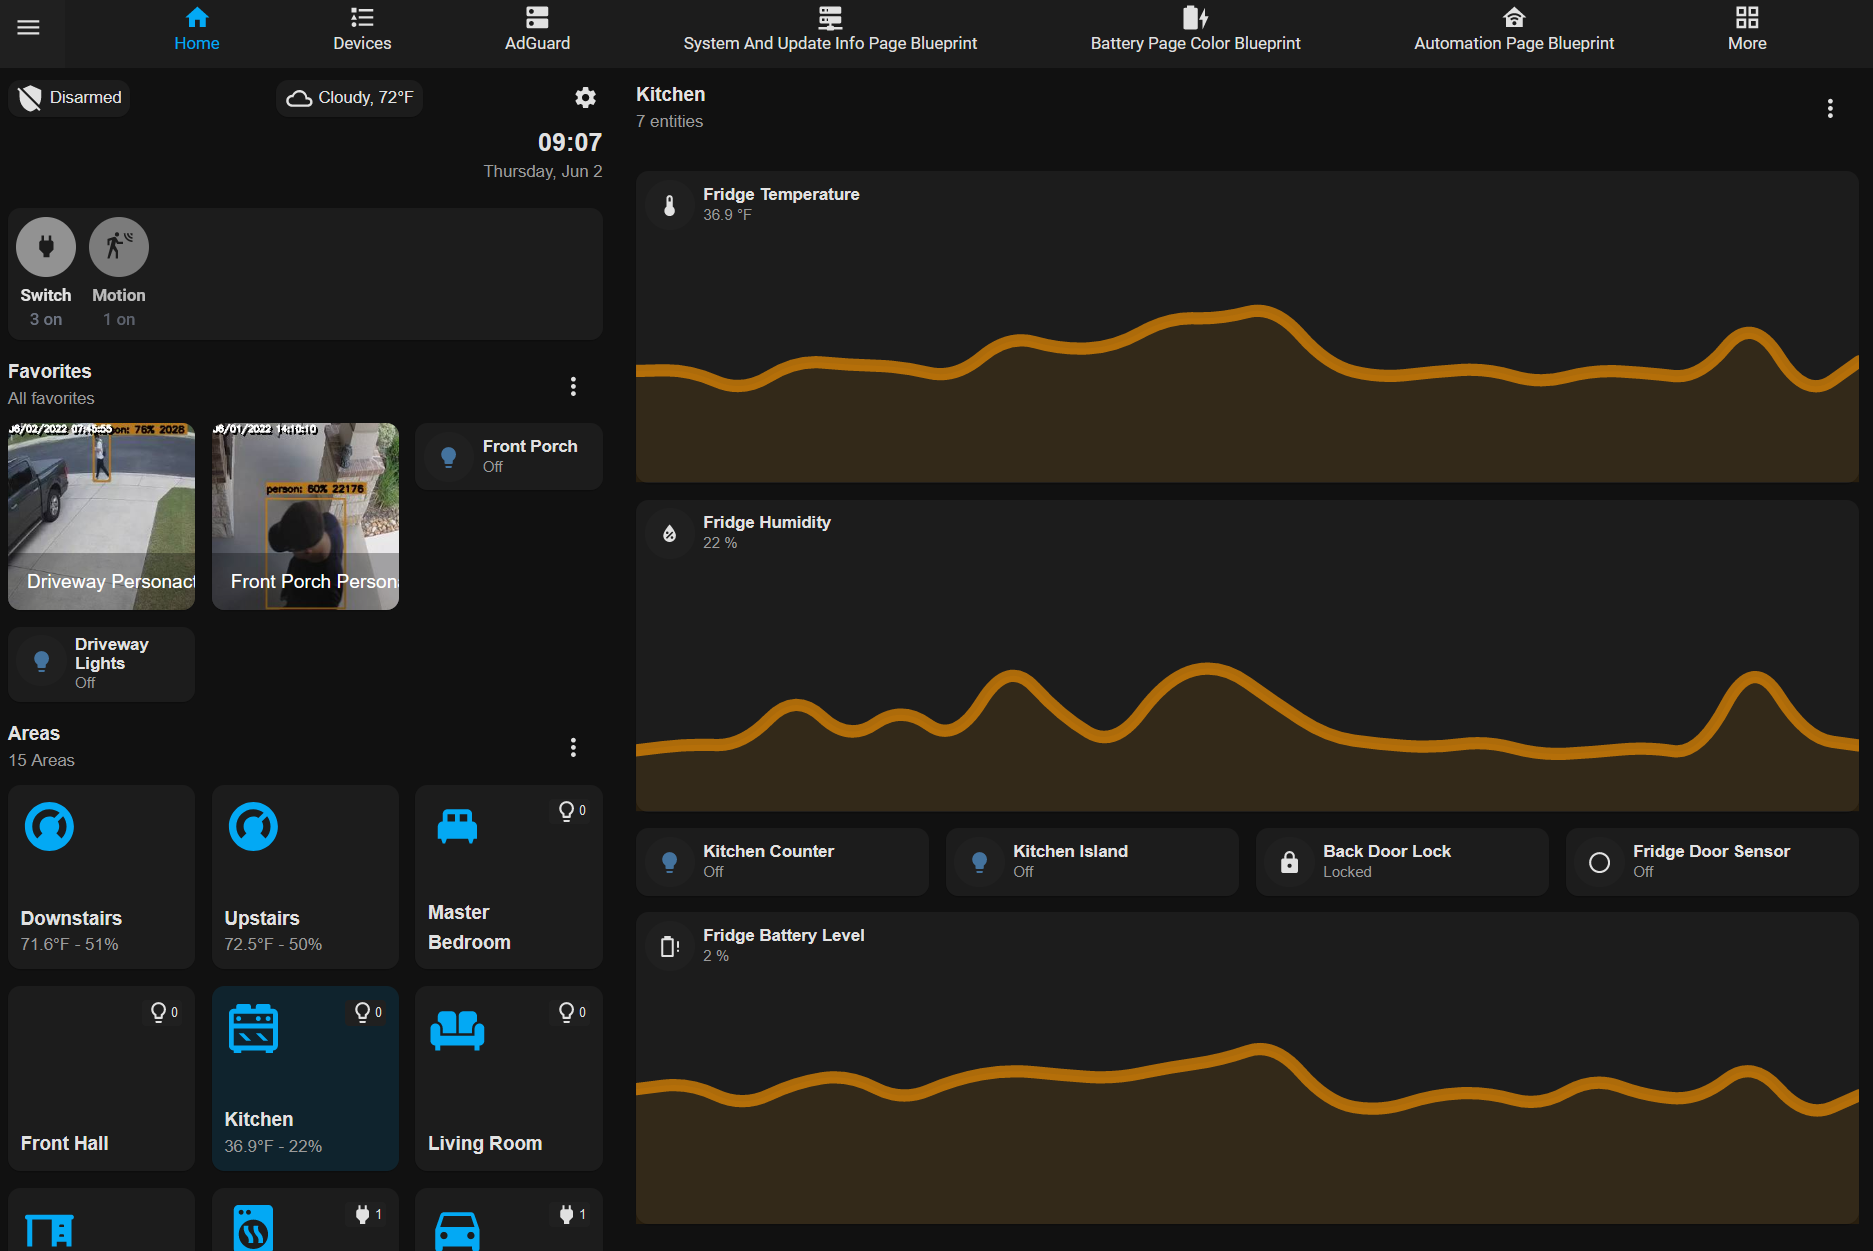
Overall, it does what it says--auto-generates a dashboard. Everything is based on the area settings for entities in Home Assistant, so it is important that you have those defined. I really didn't pay attention to areas before because I didn't use them for anything. That is probably a powerful feature I'm overlooking, but I digress. Using Dwains dashboard forced me to finally put my entities into areas. An example is my kitchen area with light switches and some graph cards showing historical temperatures/humidity in my refrigerator. This is after formatting and customizing it a bit. I also hid or disabled a ton of extra entities I wasn't interested in that show as part of this area.
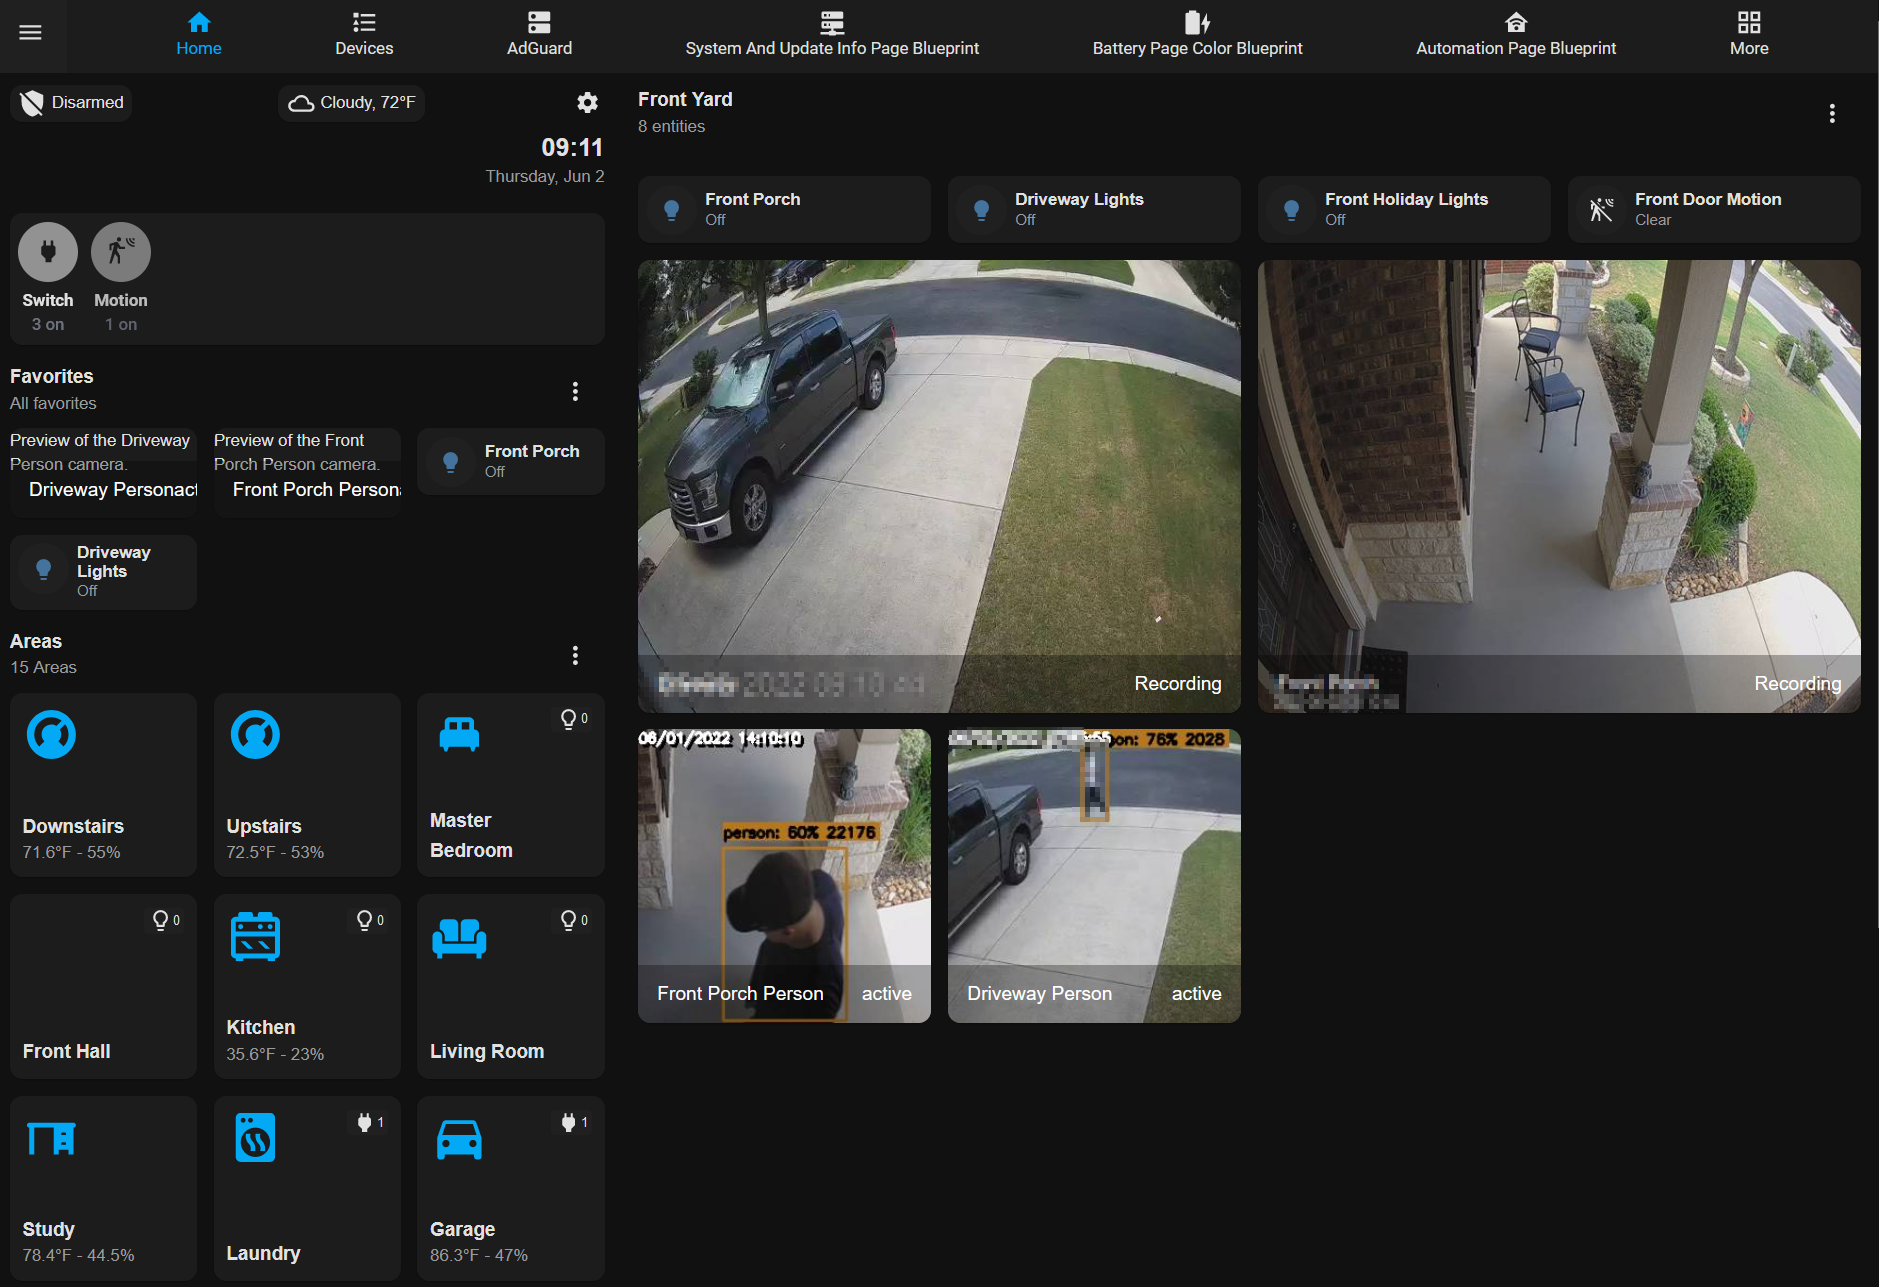
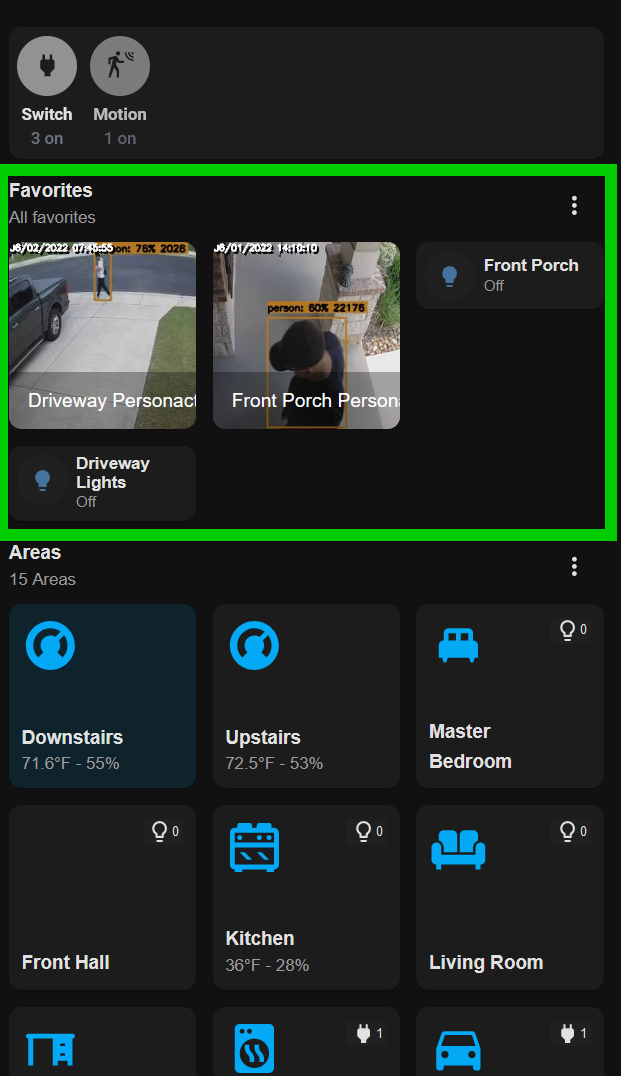
If you have cameras defined for an area as I do, you'll see those as well. You can define which of these camera entities show up. For example, I have the live feeds as well as the latest snapshot. Of course, what entities you have available to use will depend on how Home Assistant utilizes your cameras. I am using the Frigate NVR integration.
You can, of course, customize this dashboard as much as you want because Dwains Dashboard lets you use any of the already existing Lovelace cards or use cards from Dwains blueprint repository of cards (not to be confused with Home Assistant automation blueprints). You can even change the size of the cards based on screen size (PC, tablet, phone, etc).
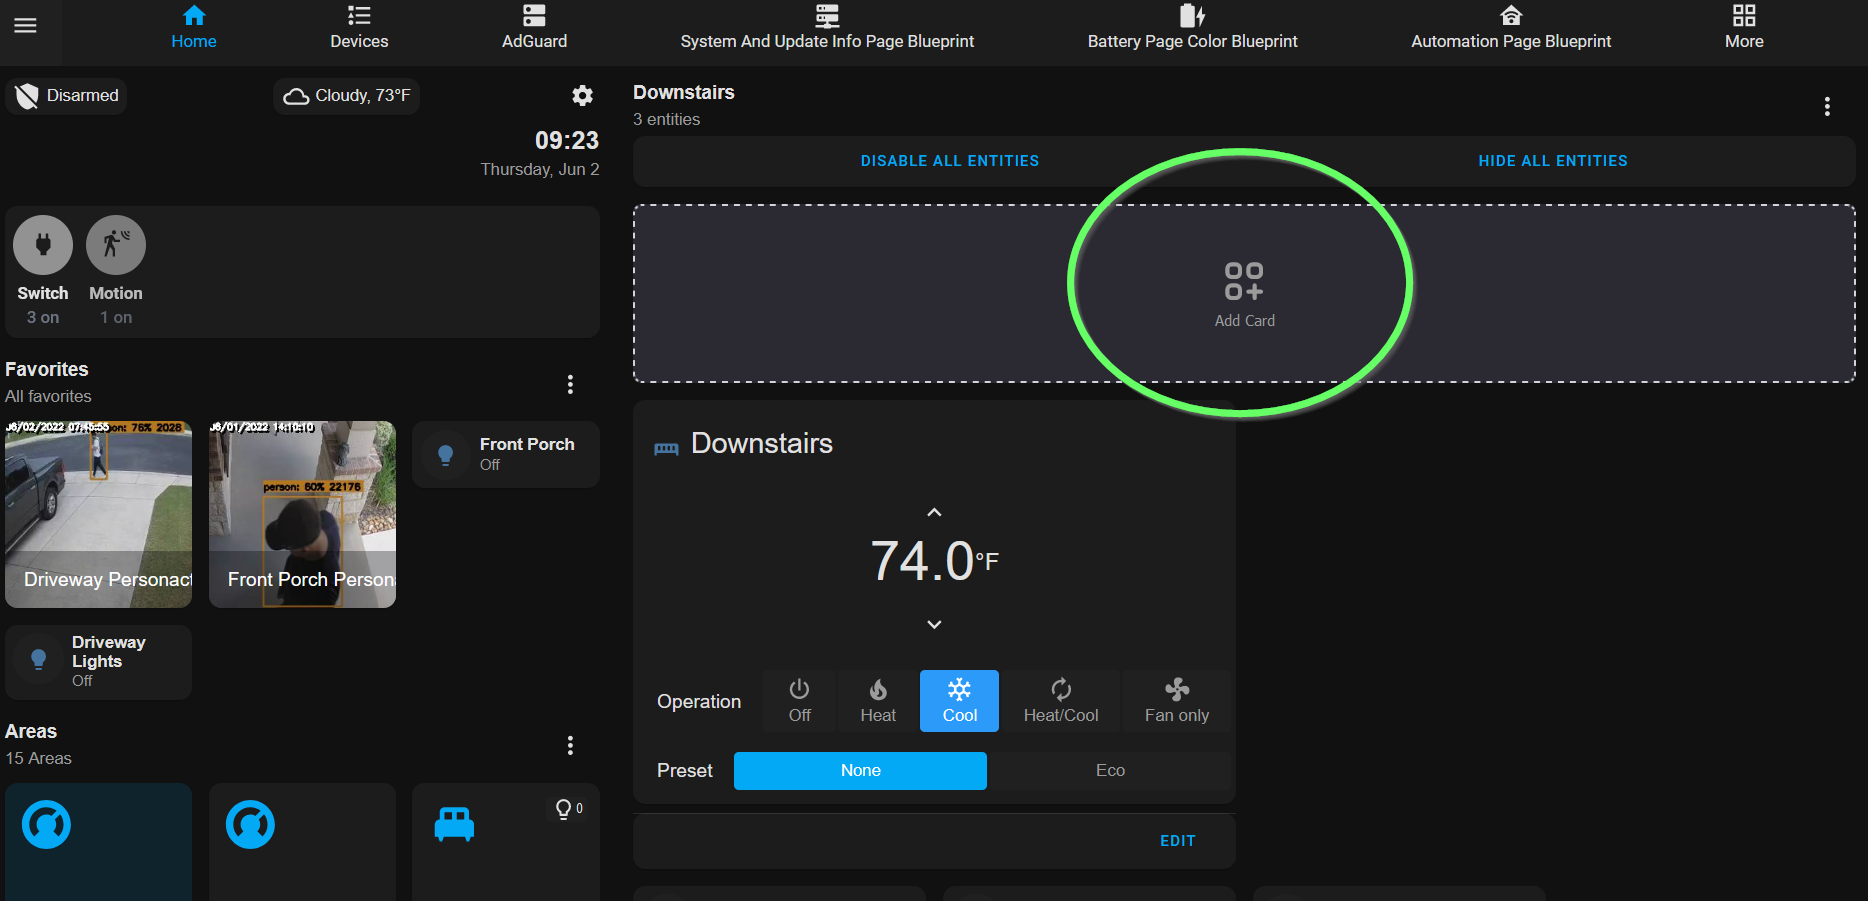
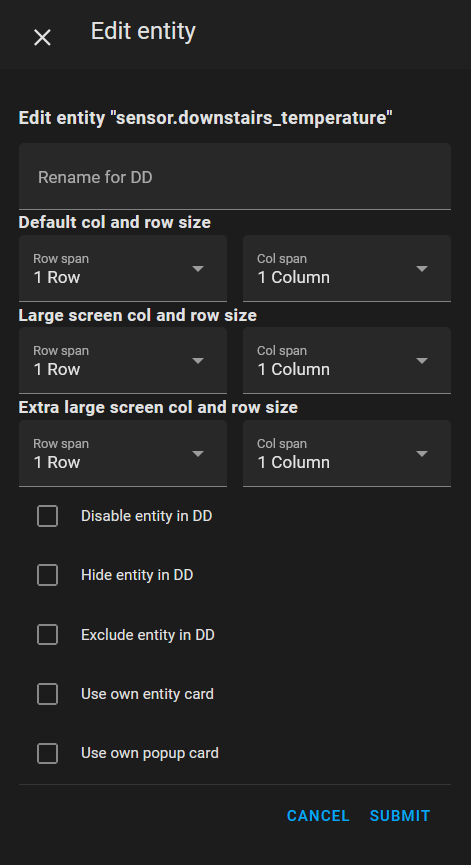
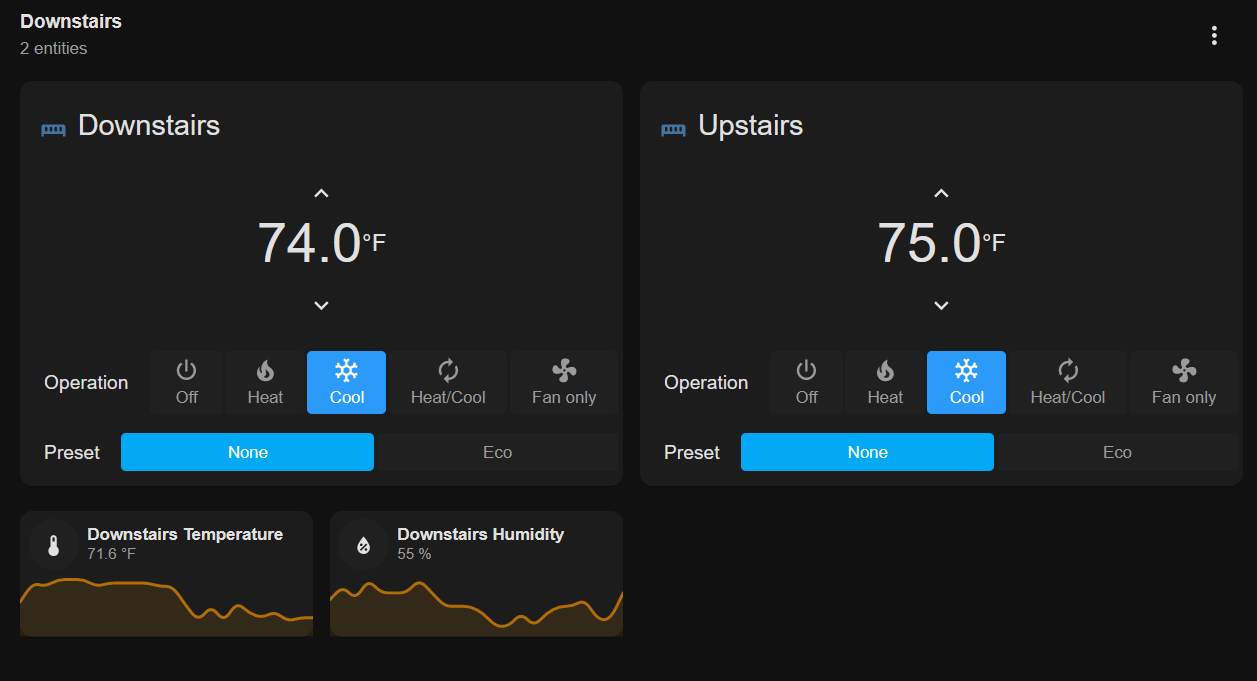
You can see the custom thermostat cards from the blueprints sized them to 2 columns for the Extra Large Screen setting. This screen size is typically desktop browser size.
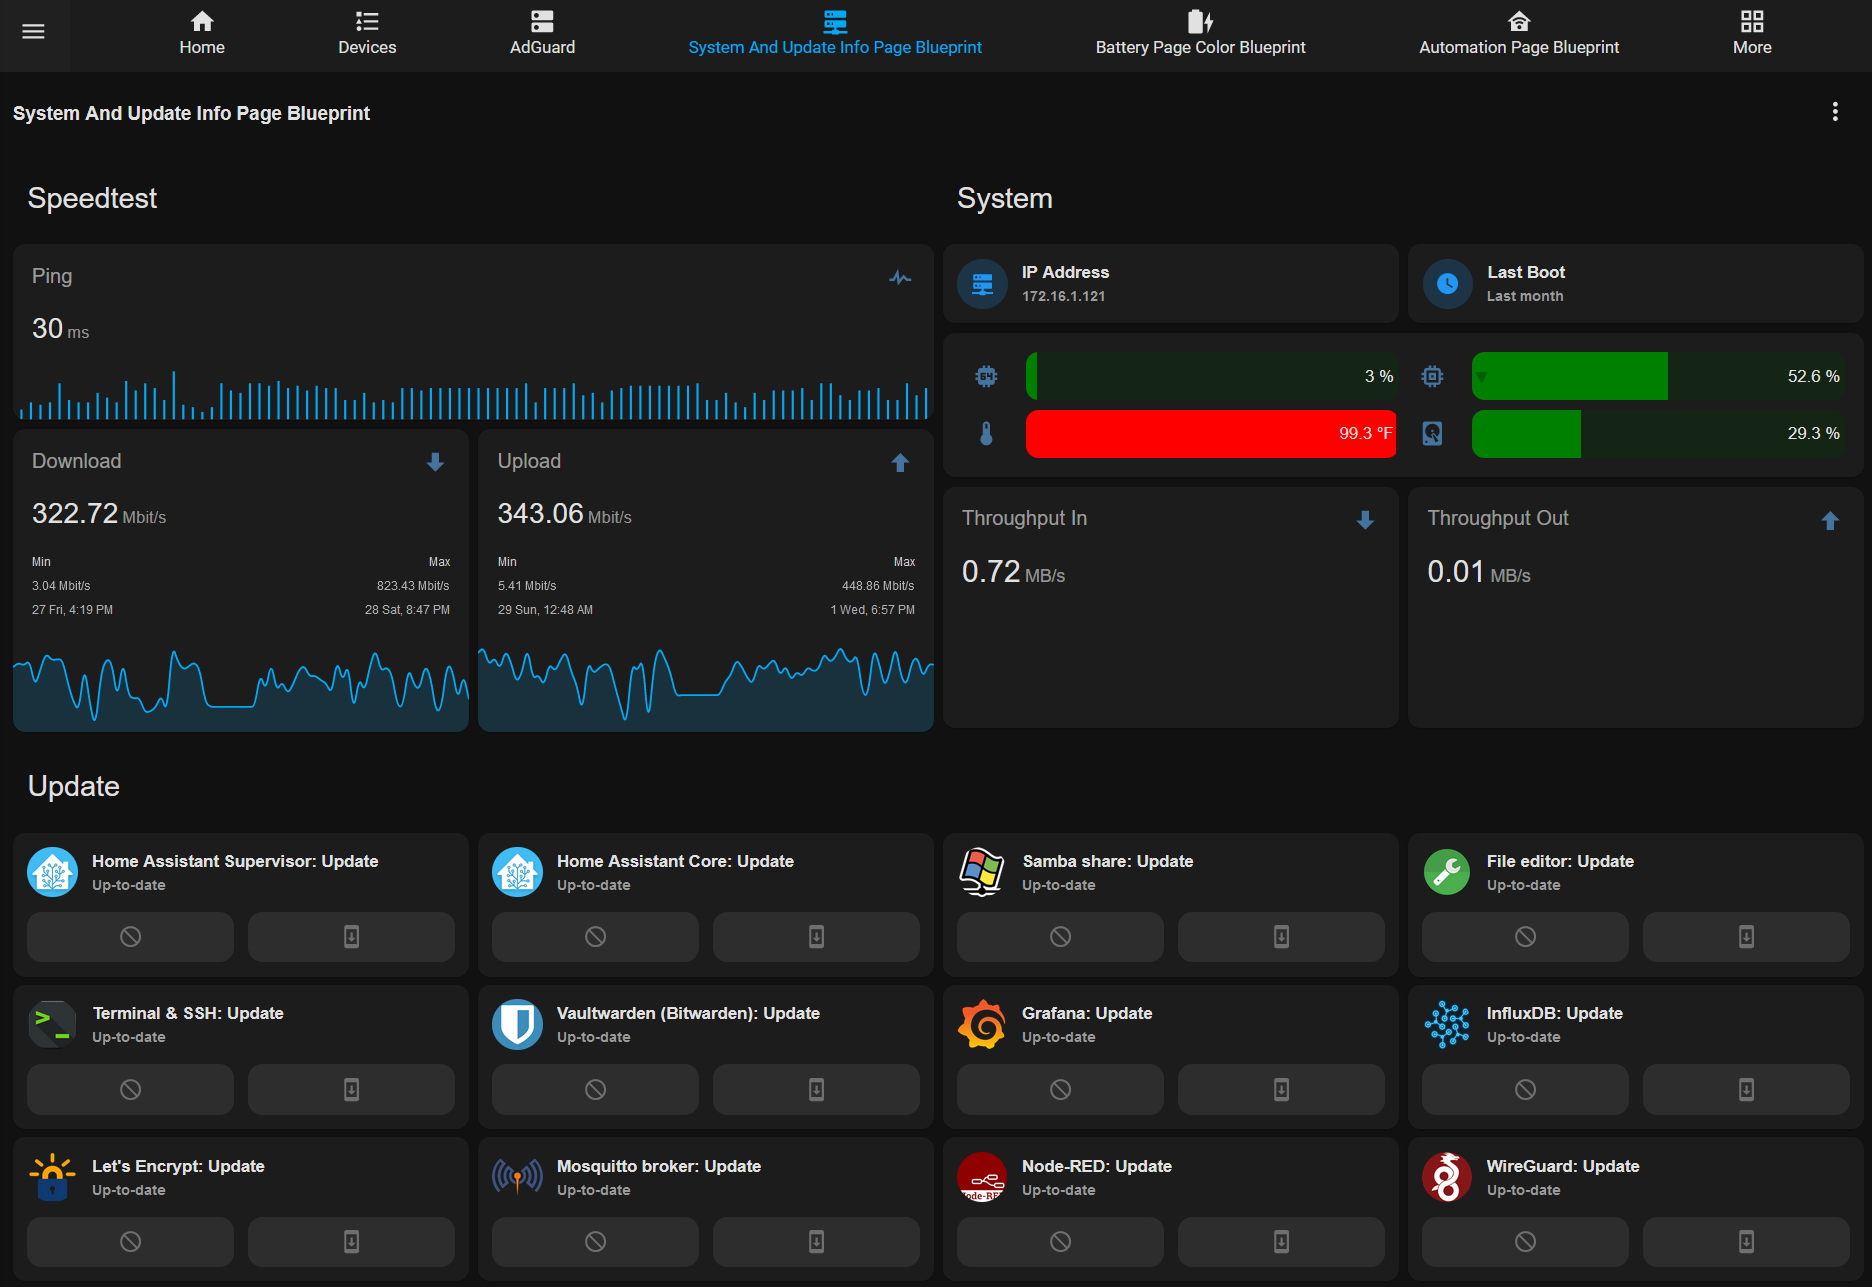
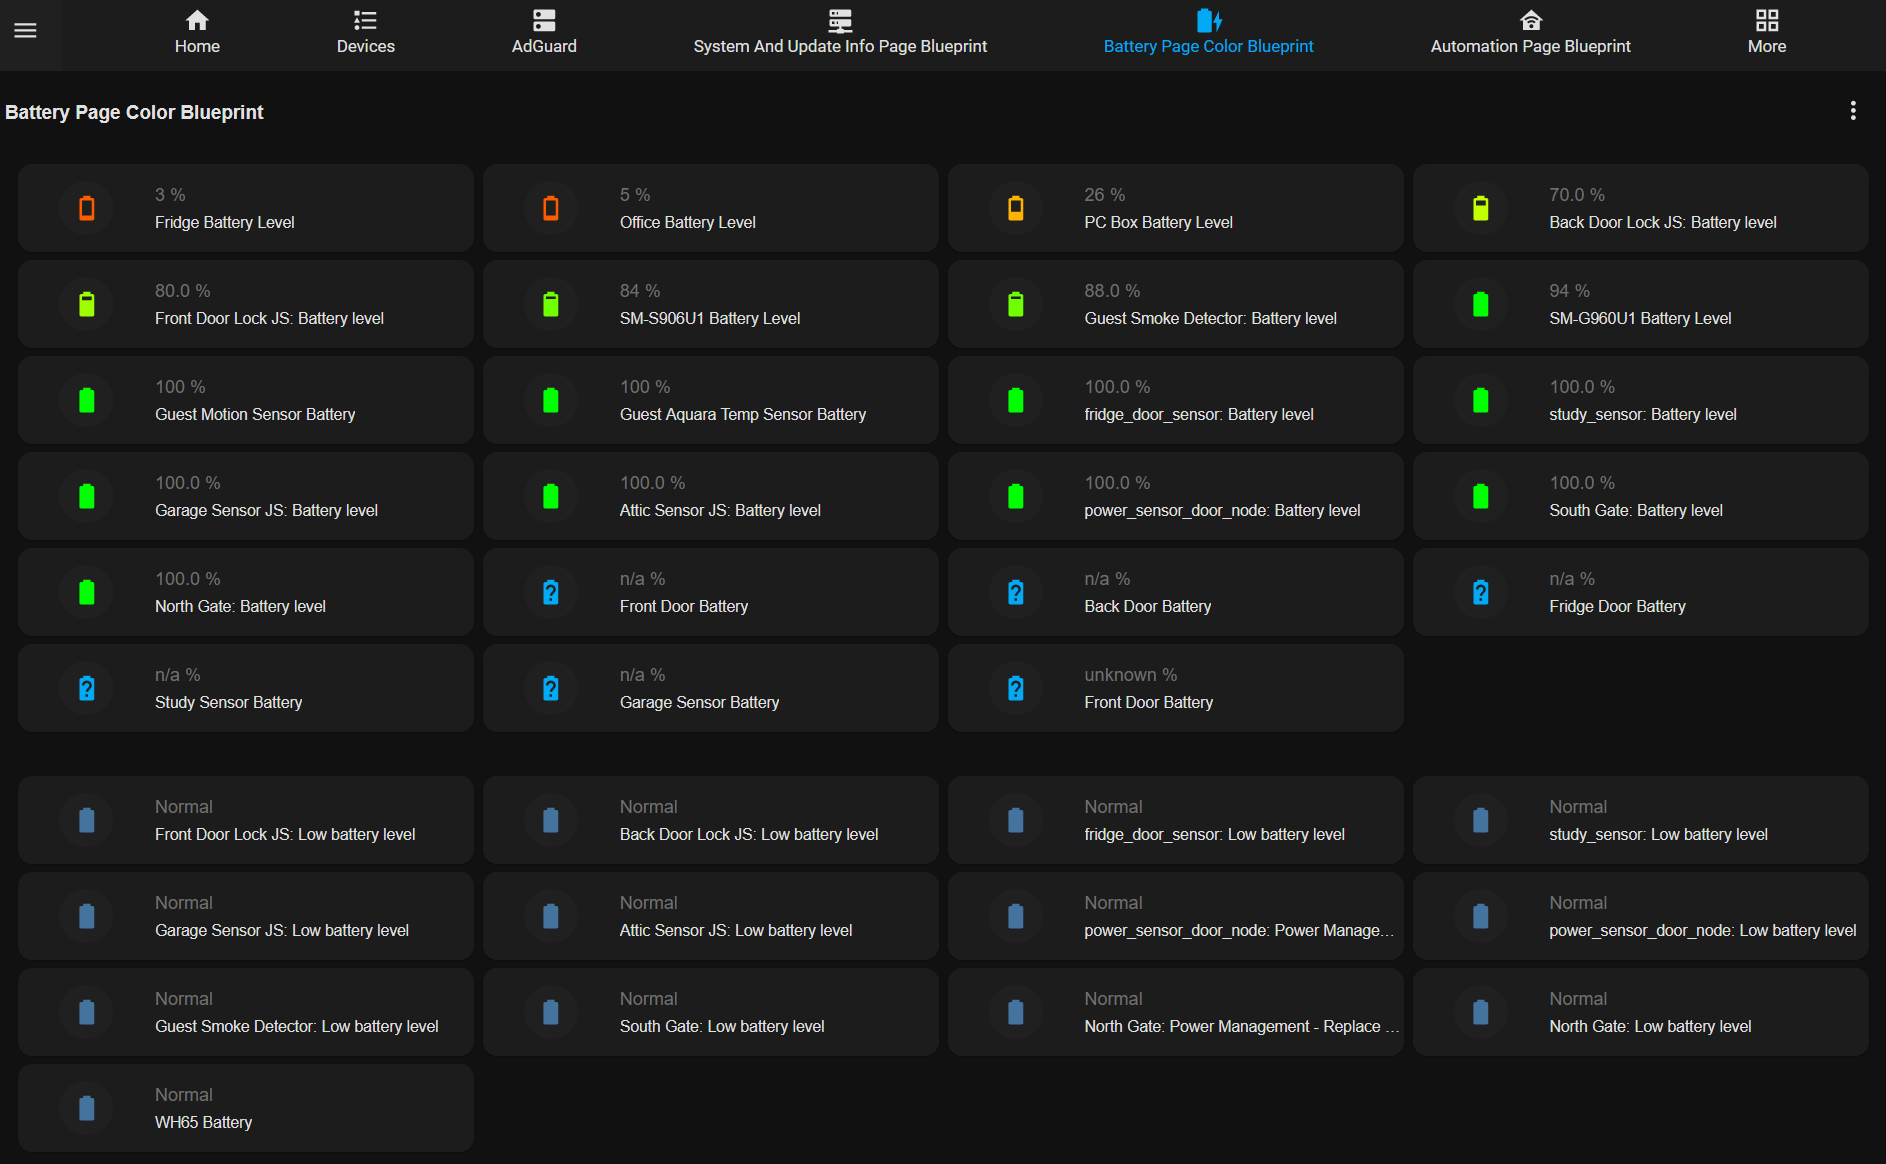
In addition to areas, you can add pages based on page blueprints.
Finally, there is a section for adding your favorites so those are always available to you on the main page. Just above the favorites is the status area that gives a quick overview of activity and what switches/lights/etc are activated.
Get all the details in the video! It's a longer one, but there is so much to cover!